Advantages:
- A high-throughput method offers a rapid and efficient way to predict severe outcomes in COVID-19 patients, facilitating faster clinical decision-making for pulmonary injury.
- Can be integrated with clinical variables to improve triage across healthcare settings, potentially reducing hospital stays, and optimizing resource allocation from home care to ICUs.
- Facilitates the identification of patients who are more likely to respond to targeted COVID-19 therapies.
Summary:
COVID-19 has been associated with features of Interstitial Lung Disease (ILD) and shares overlapping risk factors with pulmonary fibrosis. Research in idiopathic pulmonary fibrosis (IPF) has identified peripheral blood gene signatures that predict mortality, but their application to COVID-19 patients is still unexplored. Identifying similar biomarkers in COVID-19 could enhance predictions of disease progression and mortality, improving triage accuracy and resource allocation.
Our researchers have developed a novel method to predict severity from mild COVID-19 outcomes based on patient blood transcript analysis of a novel 50-gene risk profile. The expression of the 50 genes is analyzed by a scoring algorithm of molecular sub-phenotypes (SAMS) that can predict ICU admission, the need for mechanical ventilation, and in-hospital mortality. This method can predict patient outcomes and monitor treatment efficacy in real time. This system's high-throughput, cost-effective capabilities allow for rapid processing of multiple samples, facilitating timely and precise clinical decisions. Additionally, by combining single-cell transcriptomics and proteomics, they aim to uncover the cellular sources of these gene profiles, offering deeper insights into the mechanisms of COVID-19 progression and potential new treatment targets.
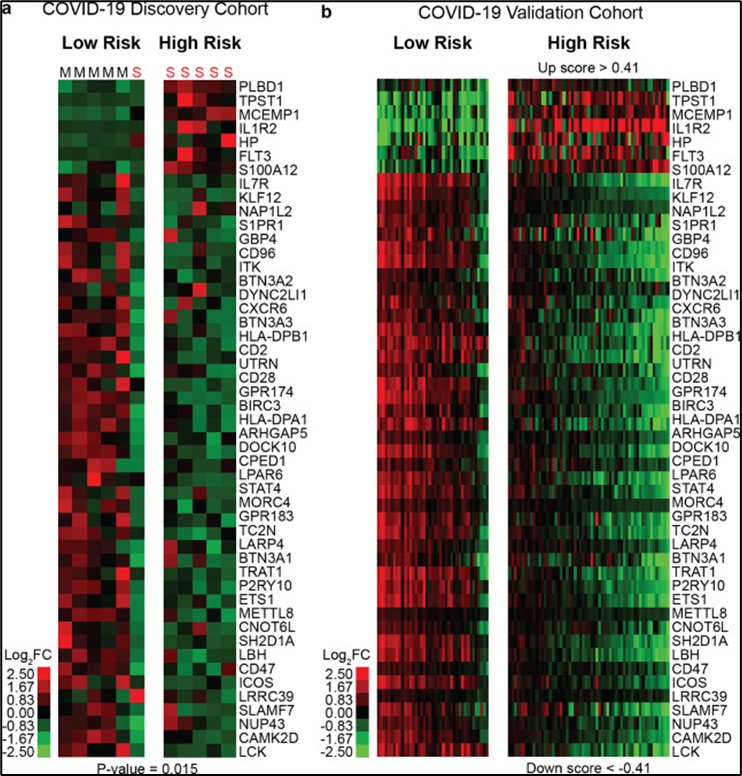
The figure demonstrates that 50-gene risk profiles can predict COVID-19 outcomes. Clustering of COVID-19 patients based on 50-gene risk profiles (High vs. Low), determined by SAMS, is shown for both the discovery (A) and validation cohorts (B). Each column represents a patient, and each row represents a gene. The heatmaps use a log-based two-color scale: red indicates increased expression over the median, and green indicates decreased expression. S denotes severe COVID-19, and M denotes mild COVID-19.De
Desired Partnerships:
- License
- Sponsored Research
- Co-Development